Hi all,
I have been working on some sampling simulation visuals (all thanks to Jeromes code) and trying to model sampling various strategies (will post another question on that).
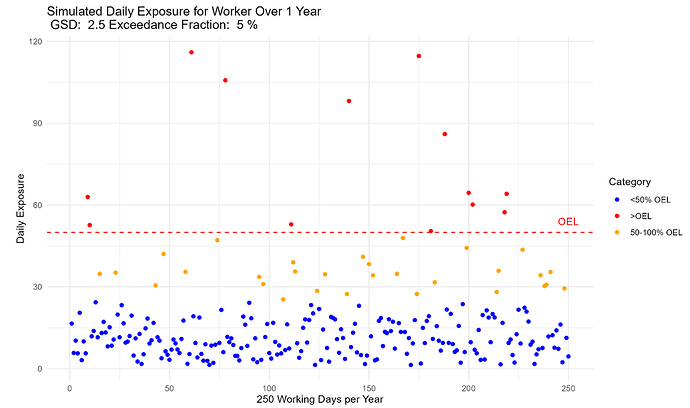
Something I have been thinking about is annual simulated exposures like the plot below. While in theory we know exposure can look like this, in reality, we know that workplaces can vary over shorter durations, with shutdowns, changes in production, etc. So there should be an eb and flow in exposures.
What would be a good way to model this for one of these annual exposure plots (or in general)? Monte carlo sim with GSD changing for each month or week for example?
I want to do this to then simulate sequential sampling. I.e. test the effectiveness of collecting 3 samples at once, vs. 3 samples spread out over the year, vs 3 samples annually at different times, etc.
Thanks all! Hope this is a fun question for you.
I was just thinking, maybe adjusting the exceedance fraction would be more appropriate than the GSD… or maybe both?
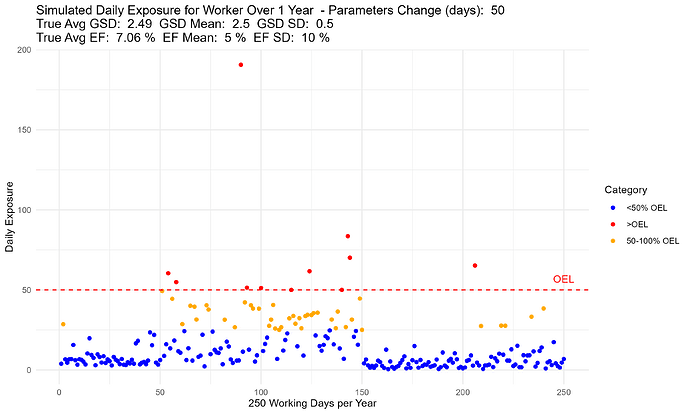
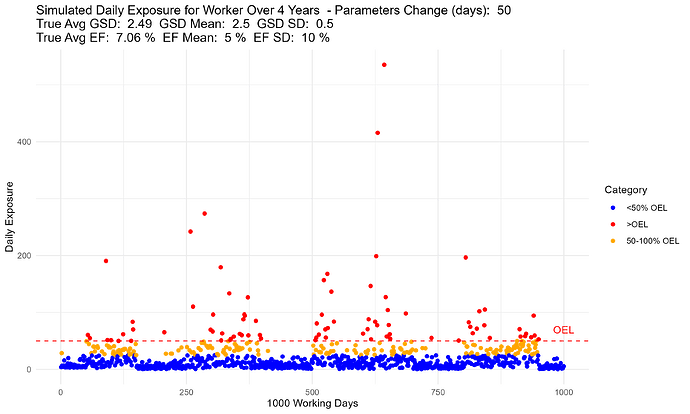
Update… I think it worked!
Now my only question is, I need to set a lower bound on my exceedance fraction. I am doing a normal distribution sampling for GSD and EF every 50 samples, but I need to set a lower bound so that I don’t have negative values for these. Does it make more sense to do a lognormal distribution for GSD and EF?
This is why my average EF is 7.06% when the mean is 5% and SD: 10%.
Any other recommendations?
Hello Mike,
Yep lognormal is a good idea for quantities above 0. There might also be better distributions to model proportions than the lognormal ( I think beta comes to mind but you’d have to search online).
Your graphs look very good, and realistic, but begs the question : how to assess risk in this realistic situation, when, because of lack of resources, we can only assume this is one big lognormal distribution from which we draw a meager sample of 6-10 sammples 
Thanks Jerome, I will try out lognormal for the GSD and EF, and look into beta and others.
I’m interested to see how spreading out samples effects the performance of various strategies given these assumptions. My guess is they will perform better than single campaigns, but we’ll see!


