Hi all,
I am doing some comparisons where I am looking at SEGs where initial sample results do not have overexposures, and then follow-up (weeks, months, years later) sampling data found overexposures. Then running stats on the initial dataset to see what the overexposure risk is, as confirmed by overexposures in the raw results in the follow-up sampling.
The documentation of the SEG assumption between the two datasets often could be better and I have had to eliminate many potential candidates.
Would it be fair to combine the two datasets and see what the combined GSD is as additional evidence that they truly are SEGs across sample events? Or could I run the analysis in tool 2 to demonstrate this? what would you recommend?
Thanks!
Mike
Hello Mike,
Some initial thoughts but I am eager to hear what others might think :
For tool2 : it is really aimed at evaluating between-worker differences, especially when there are more than just 2 workers. You could use “survey ID” in place of “worker ID” but I don’t think it would be the right strategy: the model underlying tool2 is aimed at evaluating differences within a population of units (workers by default), not the diffences between 2 units.
If you try to demonstrate the 2 datasets can be combined (despite one had at least one data point above the OEL and the other didn’t), I would rather use Tool3, where you can obtain confidence intervals for the ratios of GM, P95, and GSDS between the 2 datasets.
Such an assessment will always have some judgement in the final decision. One might recourse to formal hypothesis tests, which may give an illusion of objectivity, but in fact don’t really answer useful questions in my opinion.
Cheers
Thanks for the prompt response Jerome!
Let me provide the data. These are noise exposures as % dose for construction debris recycling sorters taken 1 month apart. I’m comparing to 66% dose as a limit.
Initial samples: 51, 49, 48
Follow-up: 93, 74, 71, 62
Wow, I have not played around with tool 3 yet, but I am loving it! Do you have any videos or documents discussing it’s use/interpretation? I would like to use this more in the future.
I used 70% CIs (40% two-sided).
Here are my comparative stats:
|Parameter| Follow-up | Initial
|GM| 74 [68-81] | 49 [44-55]
|GSD| 1.4 [1.3-1.6] | 1.5 [1.3-1.7]
|RIE| 100% | 67% [56-78]
|Exceedance fraction| 63% [53-73] | 20% [10-32]
|Exceedance fraction_UCL| 58% | 15%
|Percentile95| 130 [110-170] | 90 [74-120]
|Percentile95_UCL| 120 | 81
|Arithmetic mean| 79 [73-89] | 53 [48-61]
|Arithmetic mean_UCL| 76 | 51
Am I looking for overlap of CIs here?
In that case, the GSDs and P95 overlap, but not GM or EF.
The global GSD is: 1.4 [ 1.3 - 1.5 ]
Hello,
A difficult judgement call : comparing 2 distributions with only 3 points from each !
Overlap of CI is a way, but with small samples everything wiill overlapp…and with huge samples nothing will overlapp, even if in practice the 2 distribution are close enough…
The result that would be in that spirit but may be more useful would be the CIs on the ratio of GM and GSD :

They both include 1…back to my point above 
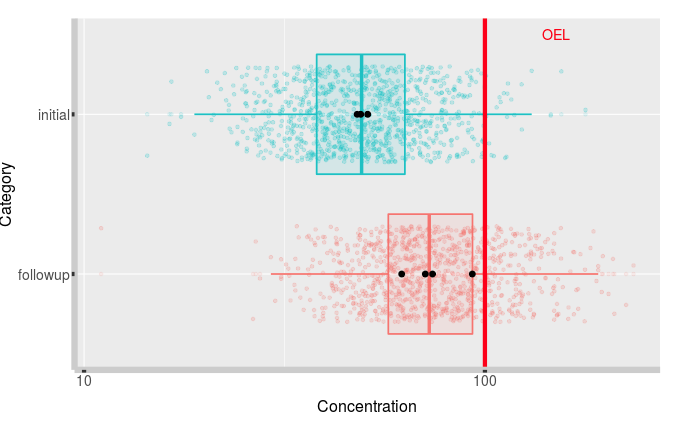
I also would use the comparative plot in tool3 :

This doesn’t look too close to me. Although the colored dots ( illustrating random values from the underlying best estimated distribution) show that the initial values are not entirely unlikely for the follow-up distributution and vice versa.
There is a Bayesian notion that would provide a better version of the plot, called “posterior predictive distribution” in twich the colored points would not only reflect the “best estimated distribution”, but also the uncertainty reflecting the fact that it was estimated with 3-4 points. The resulting graph would show much more scattered points, and would clearly suggest your data is insufficient to demonstrate something strong one way or the other.
Sorry to not be able to provide a definitive answer…Typical statistitian !
For this particular case, while the AM estimates for the 2 samples (which I would look at for noise) are different, the chances that the AM is greater than 100 are <30% in the 3 cases. The risk decision would be unchanged whatever the decision to group or not.
If you forced me to make a call, I would say “group them”.
Also : no additional documentation on Tool3 unfortunately
Thanks a lot Jerome, this is very enlightening!
I will add this analysis to my IH toolbelt.
Mike

