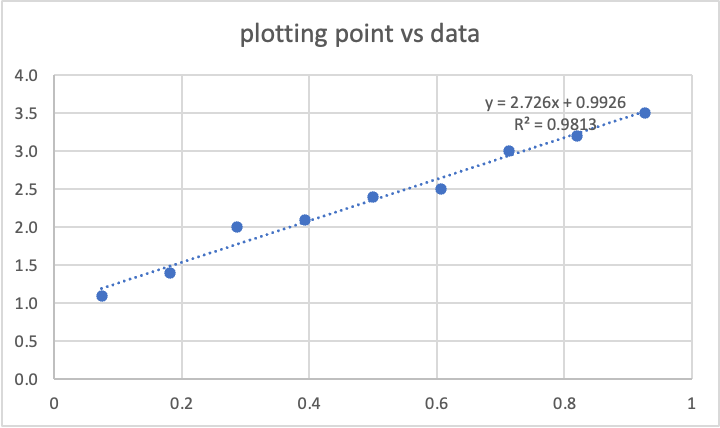
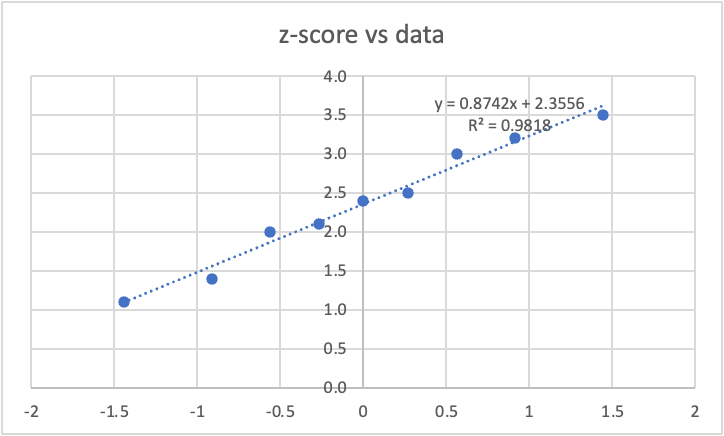
The regression equation is obviously different, but the r^2 are pretty close. Is there an important distinction between these two? In this is case you would come to the same conclusion…
Why use Blom’s formula (or any other formula) for plotting points?
I’m unable to find a copy of their paper, but the formula doesn’t split the probability space evenly. The upper and lower tails are smaller compared to the middle sections.
k / n+1 makes a lot more sense to me as it splits everything exactly equal.
(k − 0.375) / (n + 0.25)
k / (n+1)
1
0.086206897
0.125
2
0.224137931
0.25
3
0.362068966
0.375
4
0.5
0.5
5
0.637931034
0.625
6
0.775862069
0.75
7
0.913793103
0.875
For Blom, the differences between k[2] - k[1] > k[1]. Where as for k / n+1, k[2] - k[1] = k[1]
Not sure if any of this matters or not. I can’t find an explanation of the logic.
It’s been some time since I worked on plotting positions (back when I worked on NDexpo), so my reccolection is a bit burry, sorry in advance.
For the 2 equations, I don’t think it matters much, since the assessment is purely visual. However, since the plot is named a quantile quantile plot, probably the first one is better, since you show theoretical quantiles vs observed quantiles.
As for plotting positions, here is a link where I put some refs I had saved when slaving on the implementation of ROS as proposed by Helsel and the R NADA package.
One important matter in exposure data is that when it becomes censored, blom’s plotting positions go out of the window, especially with multiple censoring points. The Helsel approach is the only one to my knowledge, and was damn hard to understand and program.
There is some backrground on QQ plots and censored plotting positions on the NDexpo help pages : NDExpo
I appreciate the references! The Helsel papers looking interesting.
Actually the NDexpo help file is where I started which lead me to ask you about the Helsel book. I did have to read the rROS procedure sections a few times. Pretty clever stuff. I would have hated to program it. haha.
I was worried some of the nuences would matter in an explanation of QQ plots. But even if they did, I’m guessing most people don’t really care about the fine details of plotting points etc