Hello Mike,
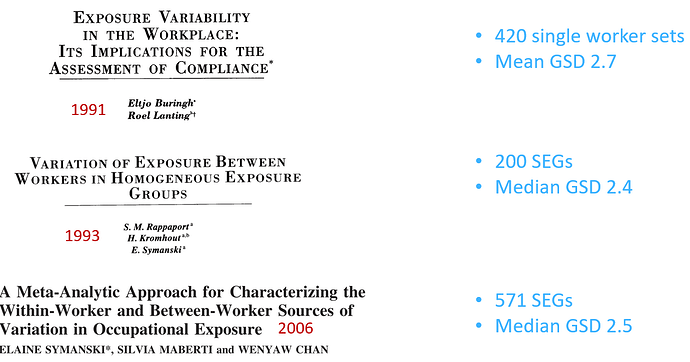
I think 2.5 as typical workplace variability results from it being a “round” number mixed with data from the papers I mentionned in my PDCs, which tend to suggest slightly lower values. Here’s below my visual summary of the available studies (some results I might have obtained by transforming/treating the originally presented data).
Additionnaly, a former PH.D student summarized more recent data reported from France at a conference from the Canadian association for research on work ands health (CARWH) in 2002. This was only a preliminary analysis of partial data (not even bayesian) but to me it is mostly reassuring as to the relevance of the older studies above : public dropbox link to pdf
Does that help ?
PS: here are the full refs for all this :
Ouedraogo D., Pfitzer, H., Chouvet, M., Lavoué, J. (2022) Updating available information on typical exposure variability in the workplace. Canadian Association for Research in Work and Health (CARWH) 2022 conference. The Changing World of Work, Health and Research. September 15-16th, 2022 (Virtual).
Buringh, E., & Lanting, R. (1991). Exposure variability in the workplace : Its implications for the assessment of compliance. American Industrial Hygiene Association journal, 52(1), 6‑13. https://doi.org/10.1080/15298669191364244
Kromhout, H., Symanski, E., & Rappaport, S. M. (1993). A comprehensive evaluation of within- and between-worker components of occupational exposure to chemical agents. The Annals of occupational hygiene, 37(3), 253‑270.
Symanski, Elaine, Maberti, S., & Chan, W. (2006). A meta-analytic approach for characterizing the within-worker and between-worker sources of variation in occupational exposure. The Annals of occupational hygiene, 50(4), 343‑357. Meta-Analytic Approach for Characterizing the Within-Worker and Between-Worker Sources of Variation in Occupational Exposure | Annals of Work Exposures and Health | Oxford Academic
