What happens when we get <90 / <90 and <90 and an OEL of 100 ?
Some explorations here
Happy to receive comments / suggestions.
Cheers
What happens when we get <90 / <90 and <90 and an OEL of 100 ?
Some explorations here
Happy to receive comments / suggestions.
Cheers
Thanks for the exploration Jerome, very educational! I recently came across some data (a datum?) with only one measurement which was below the detection limit and decided to put it into Expostats. It appears Expostats assumes a GSD of 2.3 in such cases. It might be handy if in future developments in Expostats, that the user have the ability to specify the GSD and their own prior (not saying that the assumption of 2.3 isn’t reasonable, just it would be nice to apply another GSD/mean if it is known/estimable)? This would especially be handy for single day sampling campaigns where the GSD is biased low by the sampling strategy (e.g., in one case I had 6 total dust measurements taken on the same day with a GSD of 1.2 - not likely!).
thanks again!
John
Internatoinal standards (see EN482, AIHA) demands that a measurements methods is able to detect <10% of the OELV. So please look for a better sampling method
Agree with John that people must specify the prior GSD, which is of course a property of the exposure profile or SEG under investiation. Generic GDS’s don’t exist.
If you don’t have a SEG GSD and LoD is indeed .9 times OELV you better use the non-paraemetric Binomial test - Wikipedia with p=.05, which requires a lot more samples to test (non)complince


Enclosed both AIHA Exposure control categories of IHDA .
Jerome shall we discuss the differences with Paul Hewett?
Hi Theo
For differences between Expostats and IHDA analyst, see over here :
It is fairly straightforward to use our library to replicate IHDA (as well as for Paul to replicate Expostats), so we know exactly where our analyses differ.
Nice to hear from you John.
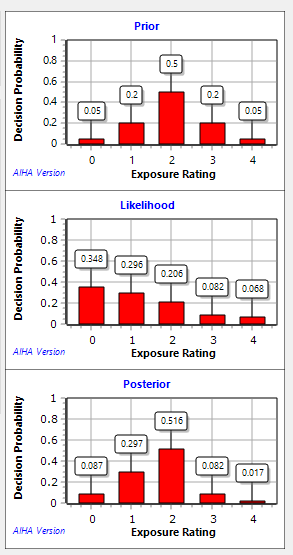
As a matter of fact, Expostats doesn’t assume a particular GSD (if you make an analysis with no you’ll see the following info for GSD 2.3 [ 1.3 - 10 ] : I.e the GSD might be anywhere between 1.3 and 10, you shouldn’t focus too much on the center of the interval/point estimate.
This reflects our prior : without other information we assume the GSD is typical as obseved in the Study by Kromhout et al., who , based on ~400 groups, reported a median of 2.3 with most values between 1.3 and 10. So when you input very few observations in expostats, the information will be a mix of whats coming from the data and what we consider “typical”. This depends on several factors, but roughly speaking, expostats will tend to pull extreme GSDs towards these more typical values, the pulling being stronger for vwery few data and very extreme GSD values.
Probably next year or so, Expostats will include a new array of customizable priors, which would allow users to be more specific about what they know ; or think they know in some cases 
I hope this answer your comment
Cheers
I’m not sure if any competent hygienist would (or should) make any declaration about those 3 results as they stand. I’m in Theo’s camp here - use a different method to assess exposure and therefore health risk. That said at what percentage of OEL censoring should be OK to assess risk ~ 10%, what about 50%?
I think your point that Expostats is not an all seeing all knowing tool is very relevant. Any tool needs to be used within its operating envelope.
Thanks Peter.
I entirely agree that facing this extreme example in real life one should act very cautiously !
The example was chosen as extreme to more clearly show the behaviour of the tools.
Cheers
It’s a great example, and currently is being played out in real life here in Australia in relation to respirable crystalline silica. Our national health & safety body is proposing an OEL of 0.02mg/m3 TWA. The most commonly used respirable dust cyclones sample at 2.2-3l/min. With the reported level of measurement uncertainty in quartz measurement being upwards of 30%, there are agencies which are establishing a limit of reporting of 0.01mg/m3. So users of that data for compliance purposes are effectively dealing with a 50% censoring limit, and I’d venture are most likely using LOD/2 for their statistical analysis.
Its a very relevant discussion and your examples highlight an under appreciated issue with compliance stats.
Hmm yes indeed ! Silica is often on my mind for these questions about high LOQs.
Do labs in Australia report results diferently as non detected vs detected but not quantified ? To my knowledge, here everything gets muddled into not quantified, but if you call the lab you might get more info.
Generally labs will report a limit of reporting value, or practical quantitation limit, not simply “ND”. Some will report the uncertainty associated with the individual sample (accounting for deposit depth/ matrix) whilst others report a general method uncertainty value.
Thanks, but will they diffentiate a result that is <PQL but detected from a “not detected” ?
And sorry for the acronyms…LOD, LOQ, MDL, ML, MRL, PQL…a real mess if one is not carefull
No haven’t seen anyone reporting “detected” but not “quantified”, whatever the acronym!!!
Hi all,
This has been a very informative thread. This question was posed to me recently and I find it very interesting. As others have noted there are exposure limits where the lab method has not kept up. I want to throw a new take into here and ask what if you used an informed prior in this case? Using IHDA or IHSTAT_BAYES? It would be challenging to do, but say you have justification based on ventilation dilution factors or modeling for an informed prior. Are there any pitfalls to applying that informed prior to a case where the LOD approaches or even exceeds the OEL? (besides the obvious accuracy of the informed prior?)
Also, do considerations change if your detection limit is above the OEL?
And if I understand your monograph correctly Jerome, you recommend putting in a range for the LOD-LOQ for a result if available?
Thanks all!
See this example using IHDA:
Data: <0.019, <0.018, <0.017. OEL: 0.02
Hello Mike,
Two links :
Another thread about heavy censoring : link
Some slides where I looked as the influence of the prior on results with only non detects : link
In essence : with such data the biggest influence will be the prior, as the data represents very little information vis à vis compliance. Within the prior, probably the lower limit for GM will be the major determinant, more than what you choose here for the different categories. See the slides in the link above to see the effect of that parameter. And yes a big part of the influence of the prior is that with no lower limit (only <) the model consider the entire prior universe. So being able to say [0.01-0.18] would be much better than just <0.18.